Introduction to DevTracer Monitor
When you start DevTracer Monitor for the first time, the
following dialog is displayed:
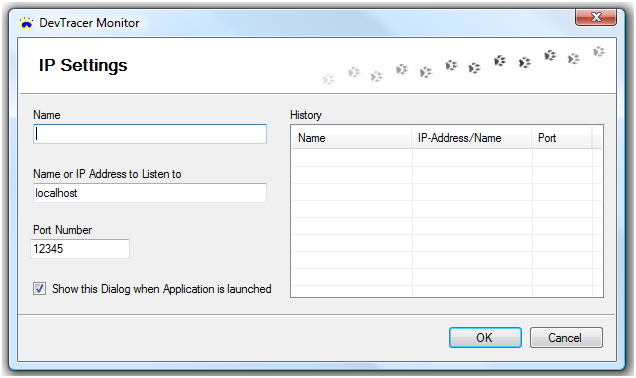
On the left you can specify the Name or IP Address to Listen to
and the Port Number. These settings must correspond to those used
by DevTracer Component used in the application which shall
be traced. Please specify a Name for the combination of
IP-Address / Port Number as well.
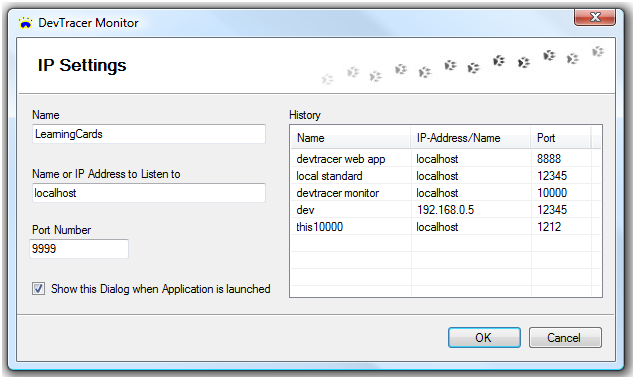
When you close this dialog with OK, the information you specified
on the left side of this dialog will automatically be saved on disk. Next time you start
the application, the information you entered is displayed in History on the
right. You only have to select it from the list and press OK to accept the
settings. The image below shows the dialog with several definitions.
If you uncheck Show this dialog when Application is launched, this dialog
will not be shown when the DevTracer Monitor is started
next time. The values from the last run will be used
automatically. To change the settings again, use menu File
→ IPSettings to access this dialog.
Now DevTracer Monitor is ready to receive trace
information. You will see:
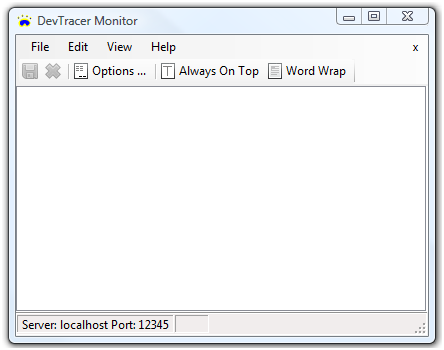
But what happens if several applications are sending trace information?
Tracing Multiple Applications Simultaneously
There are several possibilities to handle trace information from multiple applications.
-
Applications traced use identical combinations of IP-address/Port No.
You have to start one instance DevTracer Monitor. In DevTracer Monitor you can specify how the trace information
is collected using the options dialog (User Interface). This can be set
to
-
-
SDI : Single Document Interface
All trace information is collected in one window. This can be useful if you have
a desktop or ASP.NET application which consumes a Web Service and both the application
and the Web Service send trace information.
-
MDI : Multiple Document Interface
Within DevTracer Monitor a MDI child window is created for
each application.
-
Tabbed MDI: Tabbed Multiple Document Interface
Similar to MDI, except that the child windows are organized in tabs.
-
Applications traced use different combinations of IP-address/Port No.
In this case you have to start several instances of DevTracer
Monitor, one for each combination of IP-address/Port No.
Options dialog
The User Interface mode is set in the Options Dialog
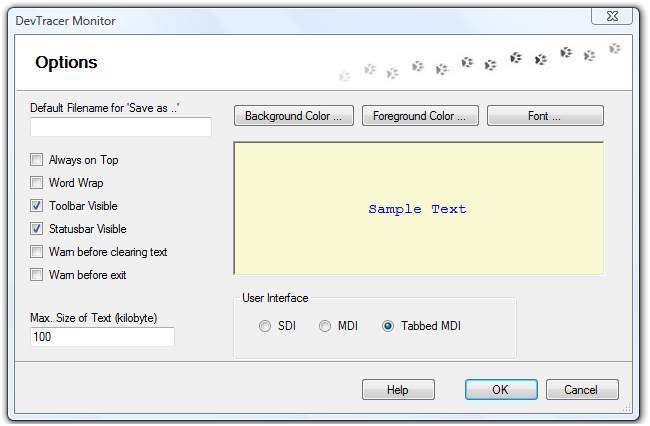
A detailed description of settings in the Options Dialog can be found here.